The Volume Profile indicator: what it is and how to use it in trading
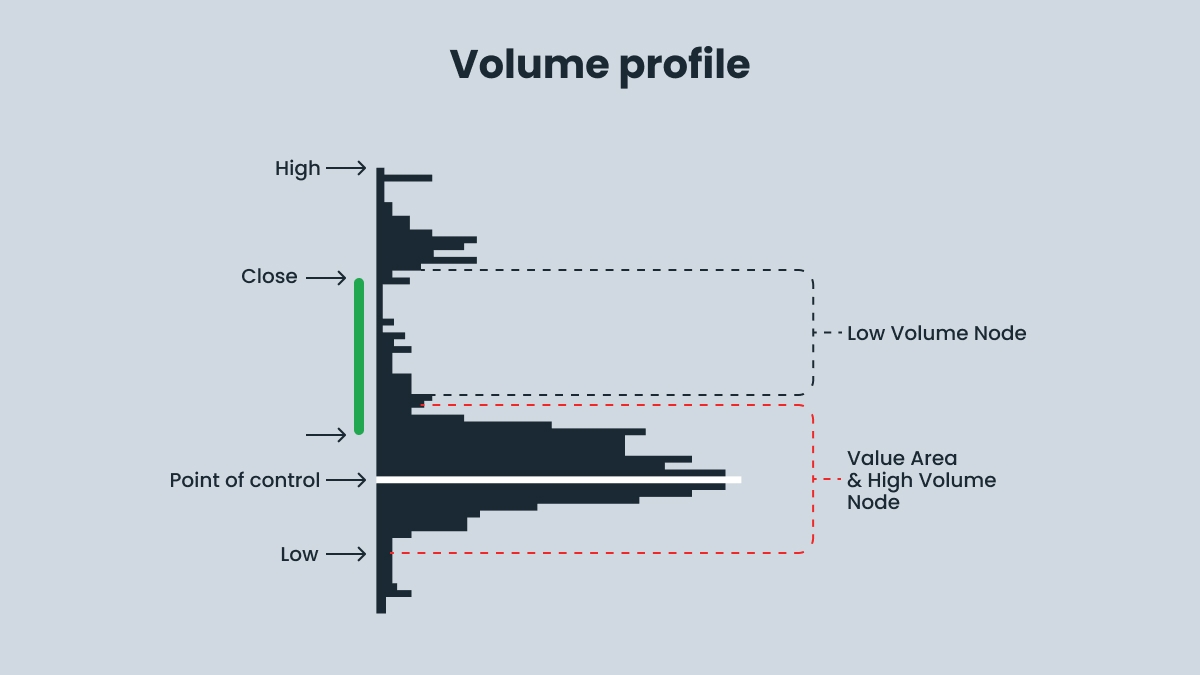
The Volume Profile indicator represents trading volume not for a period of time, but at specific price levels. The Volume Profile is presented on the chart as a horizontal histogram, where each bar reflects the total trading volume at specific price ranges. The longer the bar is, the higher the volume.
While a traditional volume indicator displays data on trading volume for a specific period of time, the Volume Profile shows the price zones where traders have made trades. The Volume Profile shows how trading activity has grown, peaked, and declined within a given period.
How the Volume Profile works
1. Price levels are the horizontal axis showing trading activity within a certain price range.
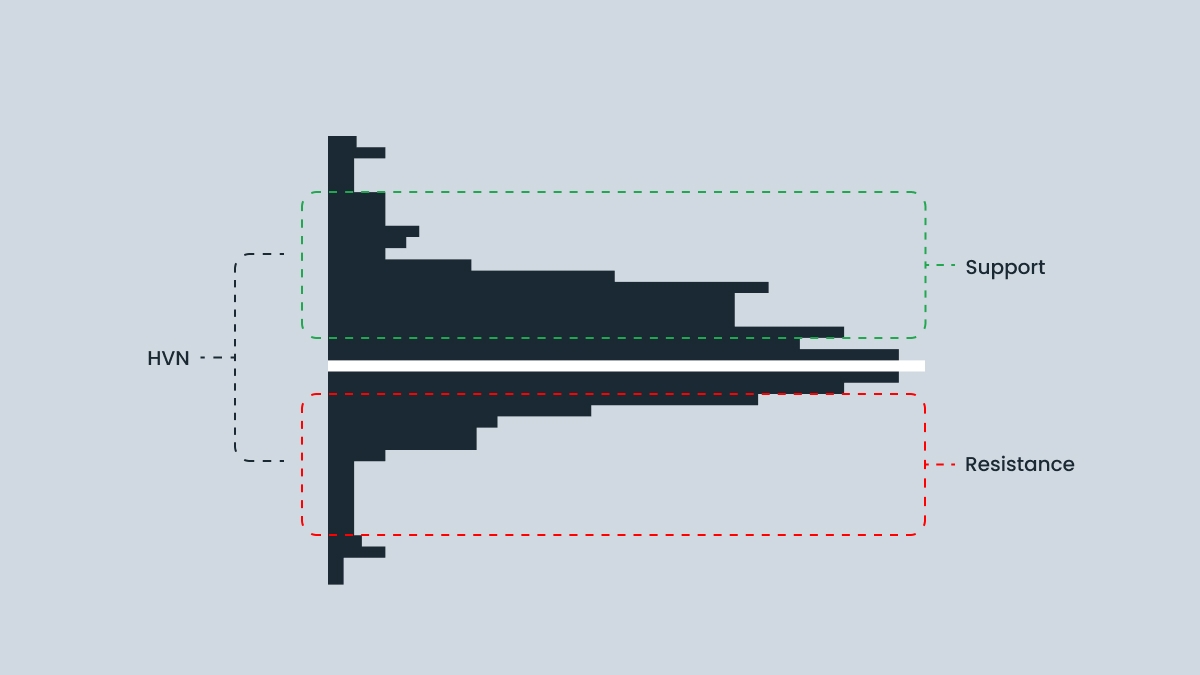
2. Volume nodes show where the largest trades were observed. They can be divided into two types:
- High volume nodes (HVN) show where significant trading activity occurрed, signaling high interest and likely areas of support or resistance.
- Low volume nodes (LVN) demonstrate minimal trading activity, which leads to rapid price changes due to a lack of interest.
3. Point of control (POC) is the level where the most trades were executed. It is usually shown as a red line.
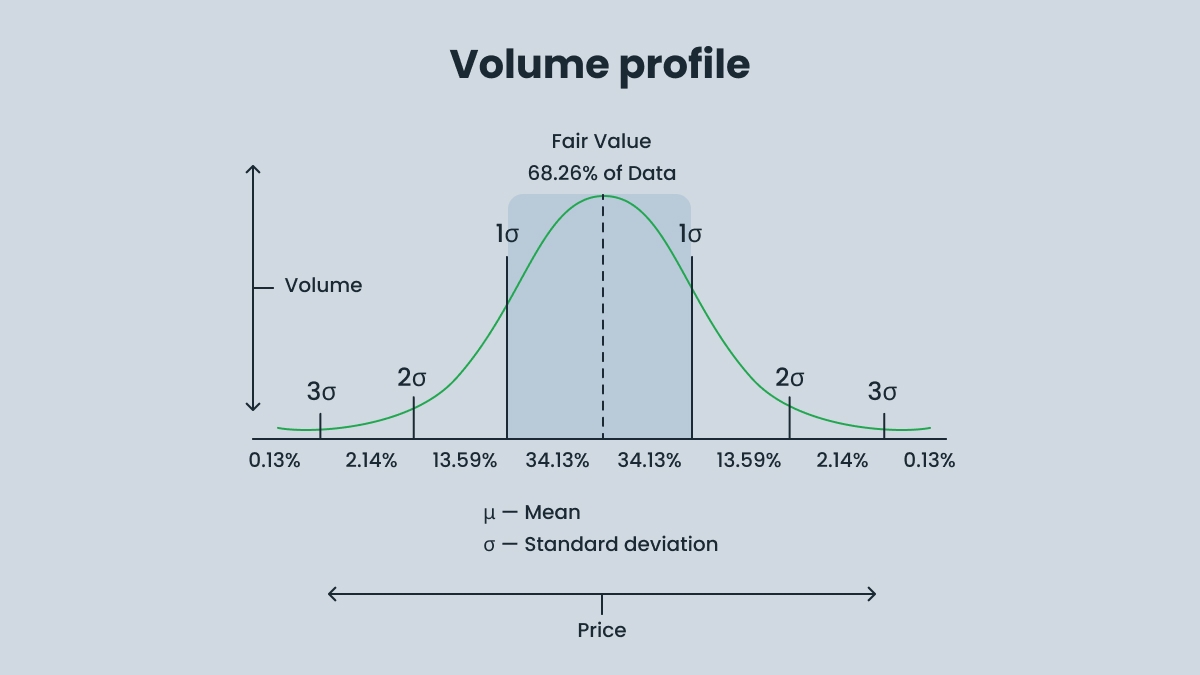
4. Value area (VA) is the range of price levels where 70% of the trades occurred. This zone is important for determining the fair price zone. This is where the balance between supply and demand is represented.
5. Volume weighted average price (VWAP) is the trading volume at each price level, which provides insight into market sentiment compared to a simple average price.