Chart patterns are the language in which the market speaks to traders, and recognizing them is the key to understanding what to do as a trader.
Sept 08, 2025
Basics
Chart patterns are the language in which the market speaks to traders, and recognizing them is the key to understanding what to do as a trader.
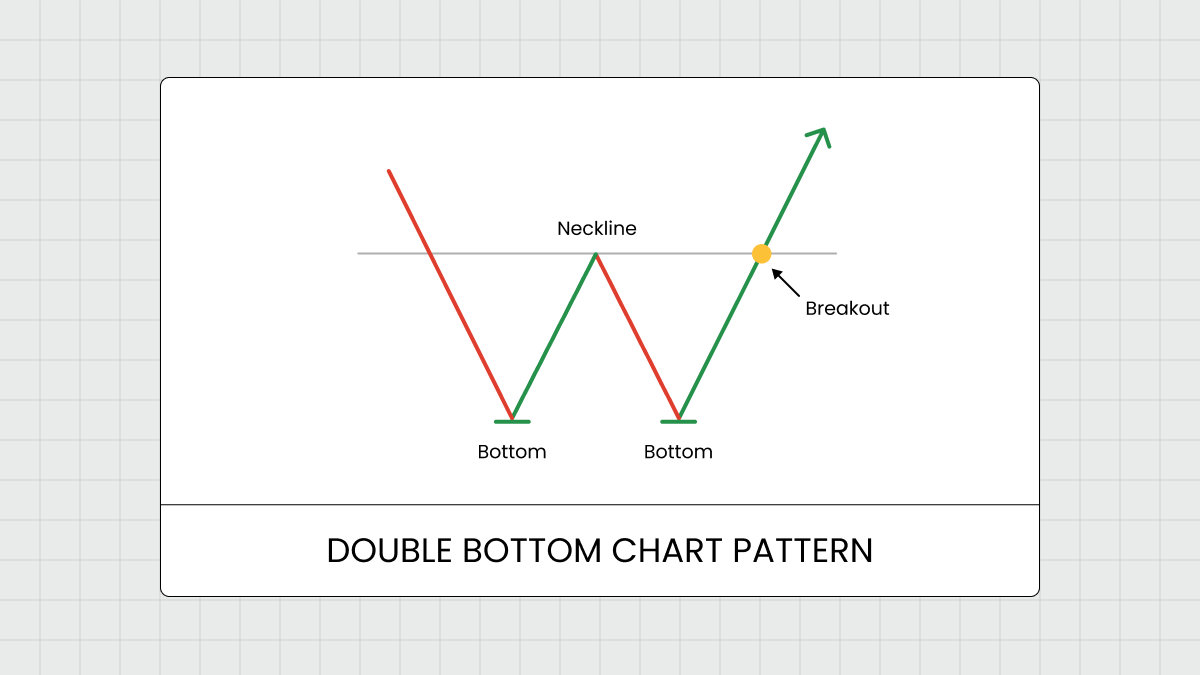
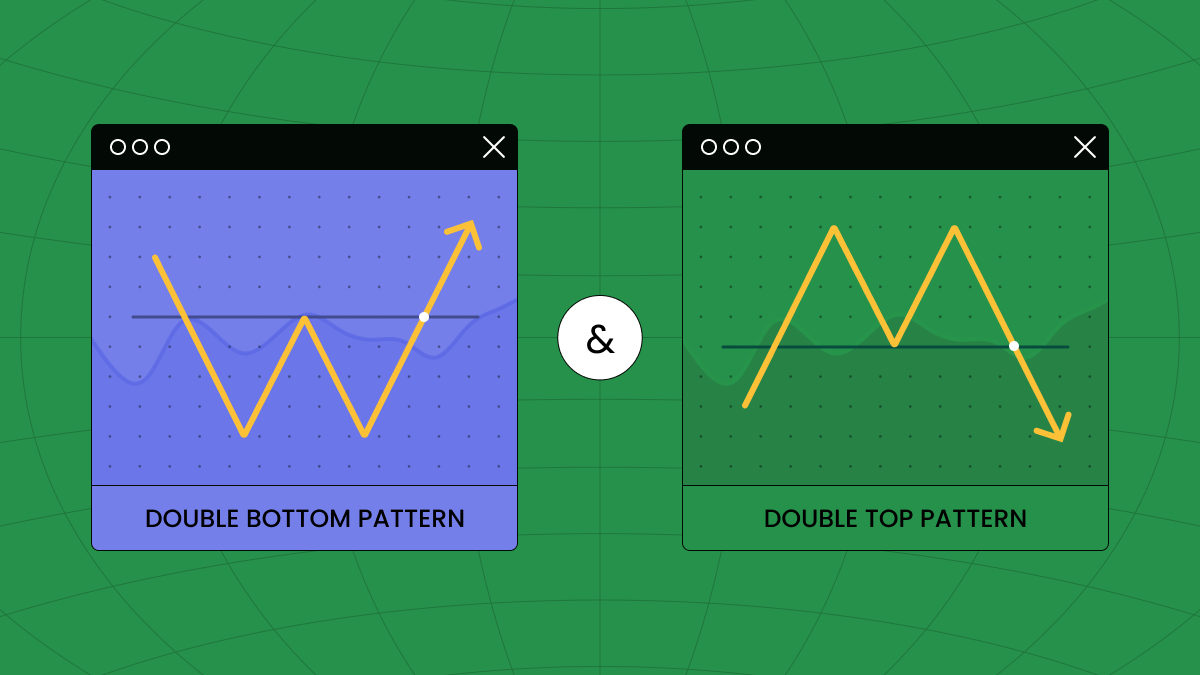
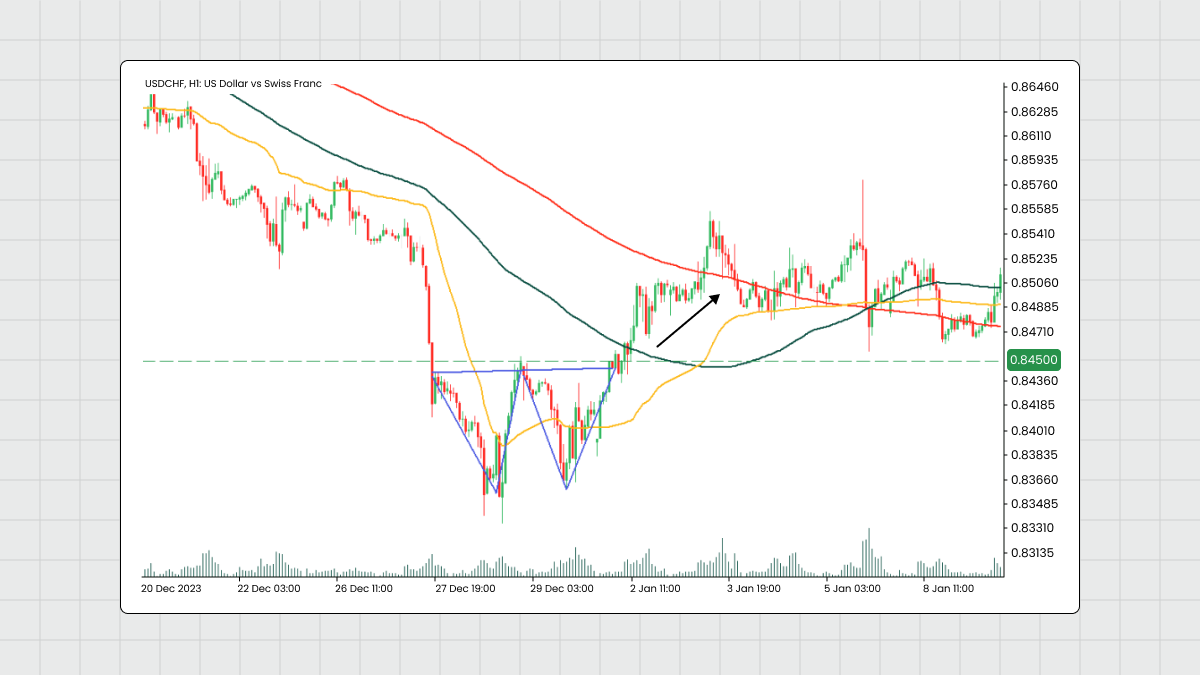
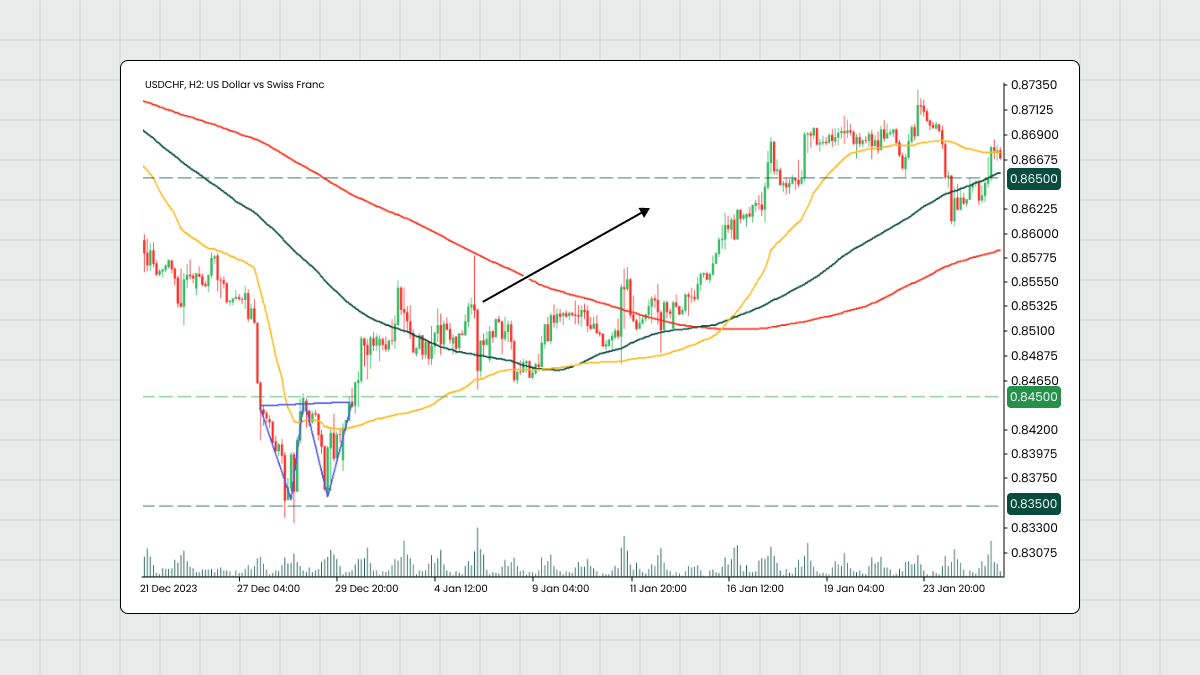
When a price has been sinking for some time and is about to reverse upward, it’ll often show an upward impulse, then bounce back to its last low, and then shoot up again, this time into higher territory. On a chart, that looks like the letter ‘W’. If, after the second bounce off the low, the price continues upward, you’ve got your confirmation, and the low will be your support.
This pattern results in two distinct lows, called "double bottom," with a distinct peak between them.
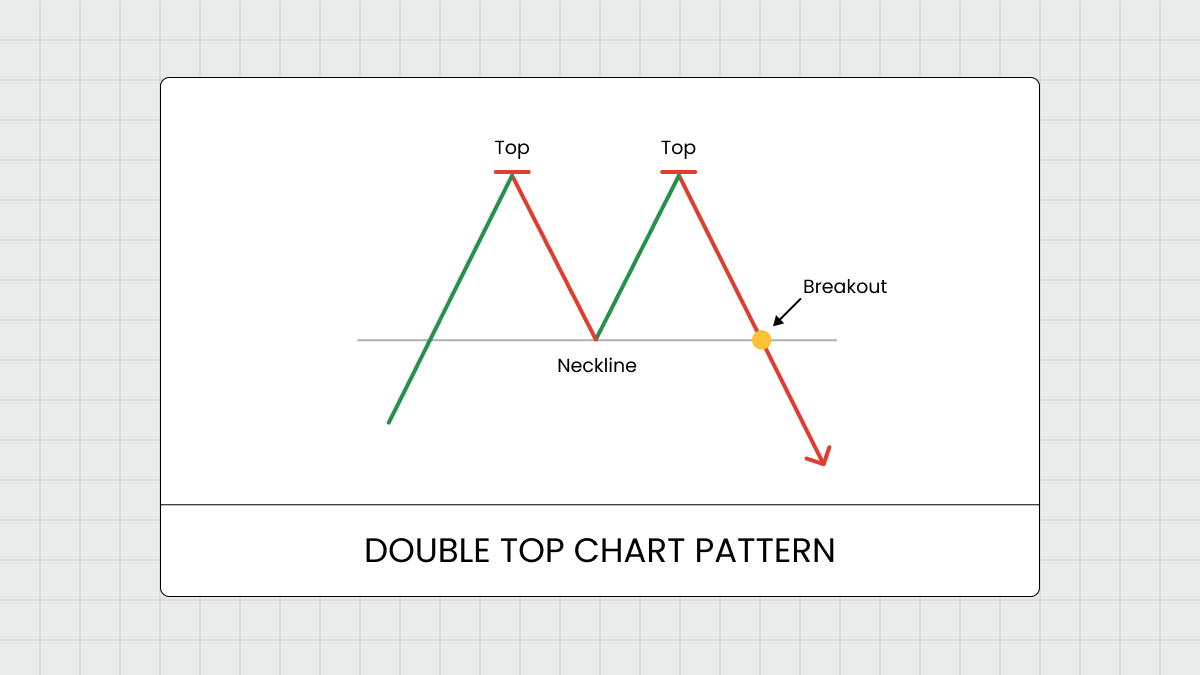
The mirror image of a bullish reversal at the end of a downtrend is, of course, a bearish one at the end of an uptrend. As ‘M’ is the mirror image of ‘W,’ this pattern looks like an M on your chart. The same exact thing happens as with a Double Bottom, but in reverse. A Double Top pattern emerges after an uptrend chart, signaling a potential reversal to the downside. It's characterized by two consecutive peaks at the same price level, separated by a trough.
This formation indicates weakening buying momentum and increasing selling pressure.
Look for distinct W and M shapes on your charts. Notably, these formations should be accompanied by a decrease in volume, which weakens the underlying impulse.
It’s a good idea to use complementary indicators like moving averages or oscillators to reinforce your analysis.
Always be aware of market sentiment, economic news, and geopolitical events to avoid falling into the trap of false breakouts.
If the patterns you identified as a Double Bottom or Double Top turn out to be just W- and M-shaped flukes on your chart (from which no one is immune), you could lose big before you know what hit you. That’s why you should never neglect to set a well-placed stop-loss. It should go just below the lowest low of your Double Bottom, or just above the highest high of your Double Top. To hone in on the exact levels, look to technical analysis tools and take into consideration the previous support/resistance levels. Aim for a 1:2 risk-to-reward ratio and you’ll always come out on top.
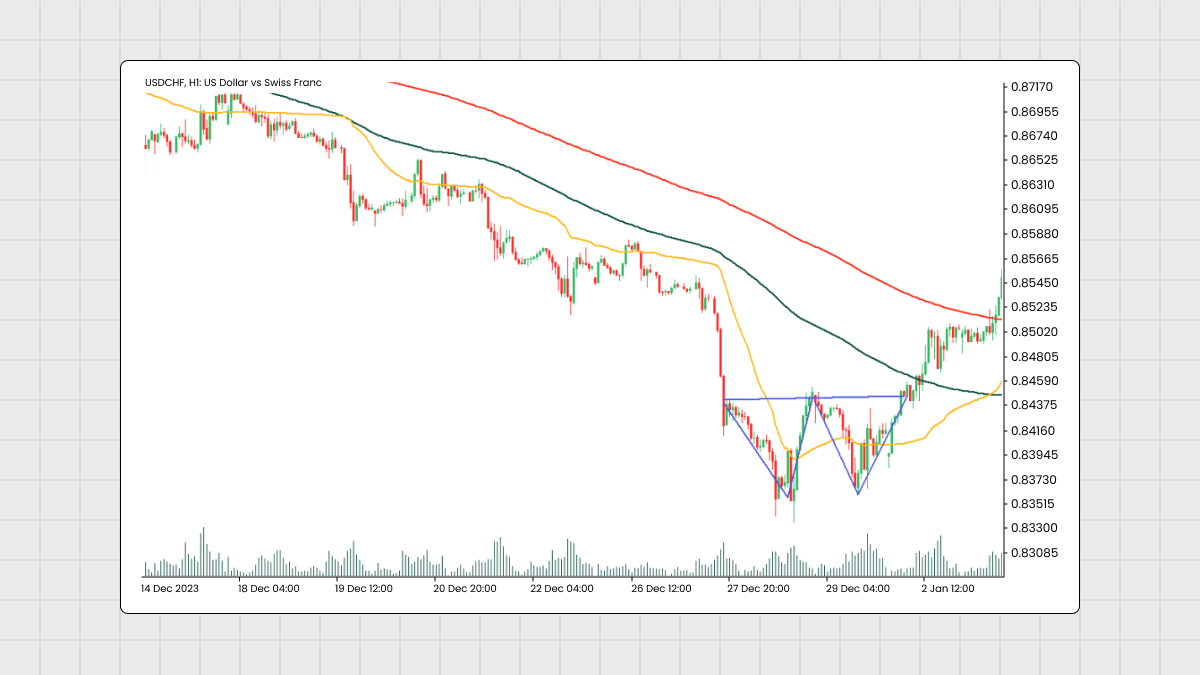
To illustrate the application of the Double Bottom and Double Top patterns in real trading scenarios, consider the following example:
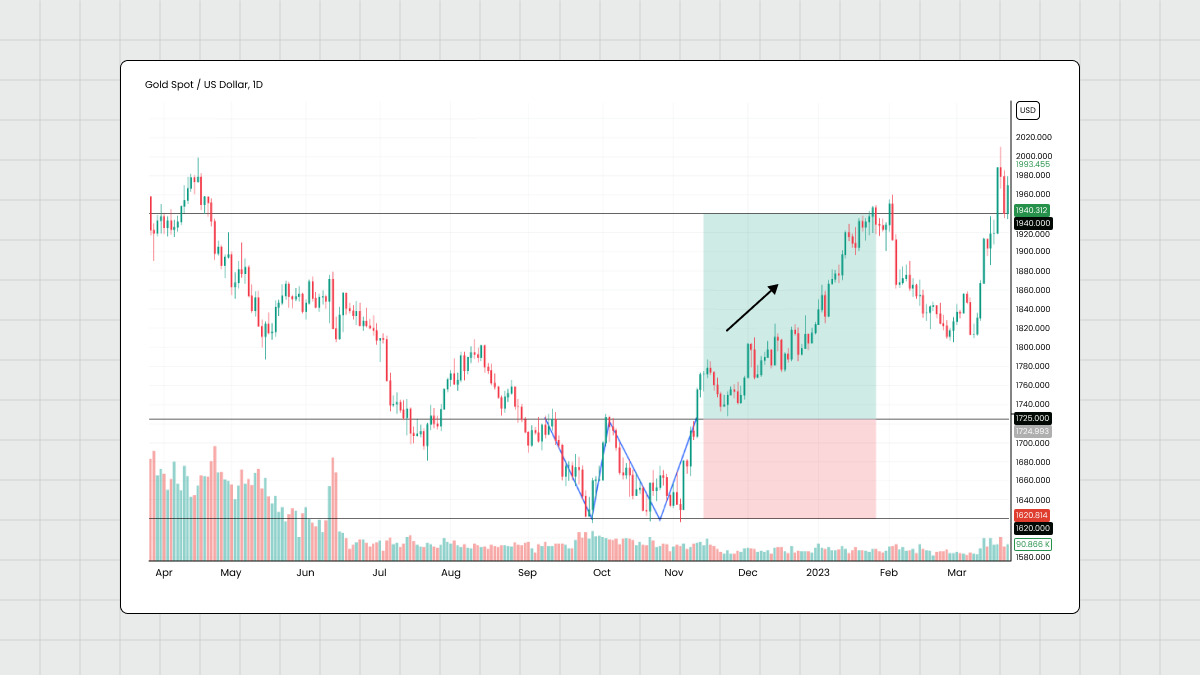
After a long downward trend, we find a Double Bottom pattern that forms on the XAUUSD. The first bottom occurs at 1620, followed by a moderate rebound. Subsequently, the price returns to 1620, creating a second bottom. We observe a decrease in volume during this formation, indicating a potential reversal.
A double bottom confirmation occurs when the price breaks the upper resistance line (neckline) formed by the pattern at 1725. The trader then enters a long position, anticipating a reversal in the bullish trend. To manage risk, they place a stop loss below the lowest point of the double bottom at 1600.
As the price rises, the trader sets the take profit level based on the previous resistance level 1950, targeting a risk-to-reward ratio of 1:2 . Once the price reaches a predetermined take profit level, the trader closes the position, securing the profit.