Donald Lambert developed the Commodity Channel Index (CCI). The word commodity in the indicator's name might seem to suggest that the indicator applies only to the analysis of commodities like oil or gold. But this indicator can be used for analyzing and making decisions about other assets, as well. Let us understand how it works.
How to calculate the CCI Indicator
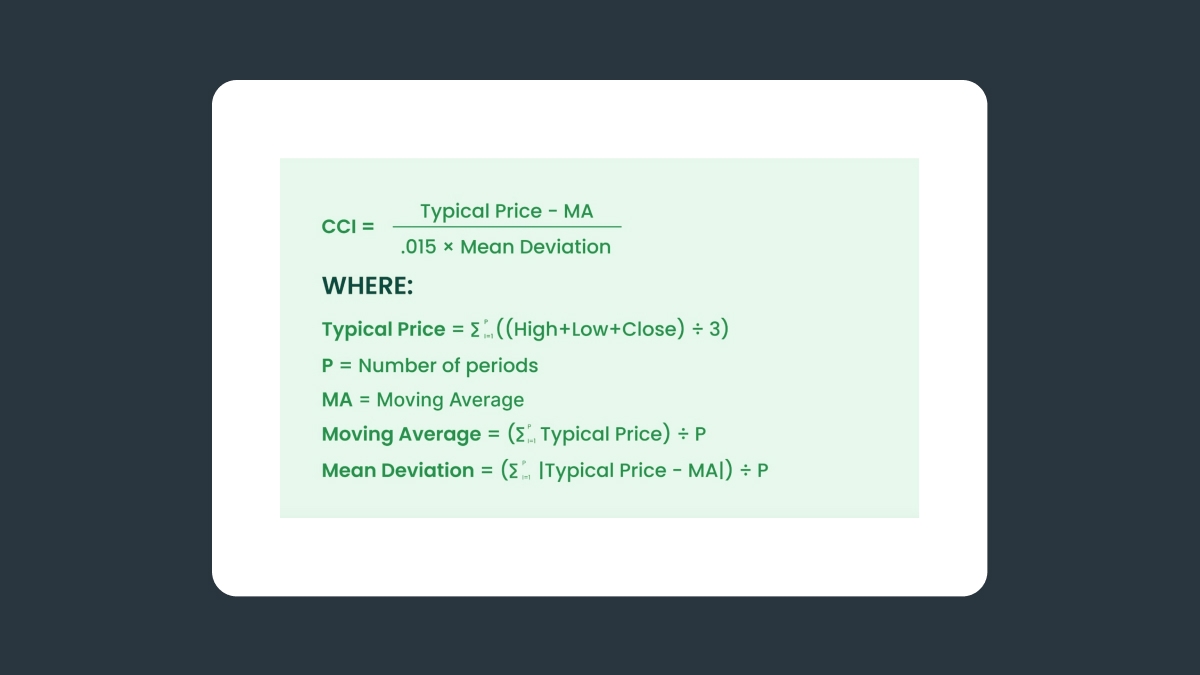
The CCI is an indicator of the speed of price change. The calculation resembles the calculation of the average deviation in statistical analysis.
The CCI indicator is calculated using the following formula:
How to Implement the CCI Indicator
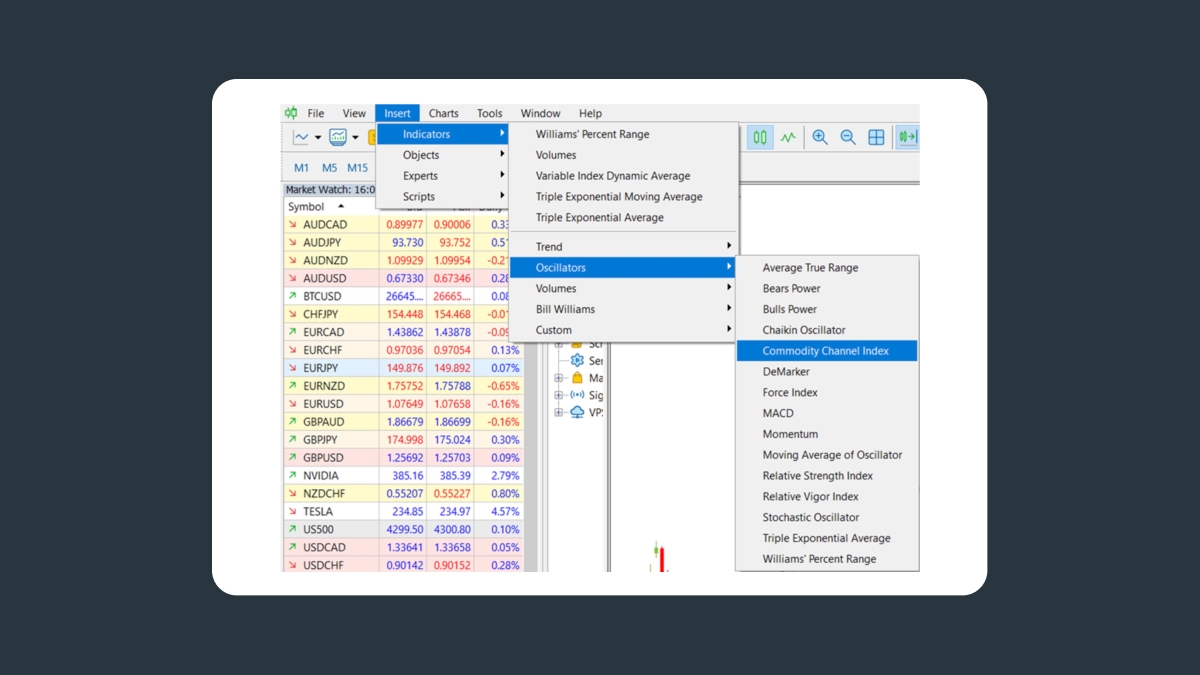
To select the Commodity Channel Index indicator in MetaTrader, select
Insert -> Indicators -> Oscillators -> Commodity Channel Index
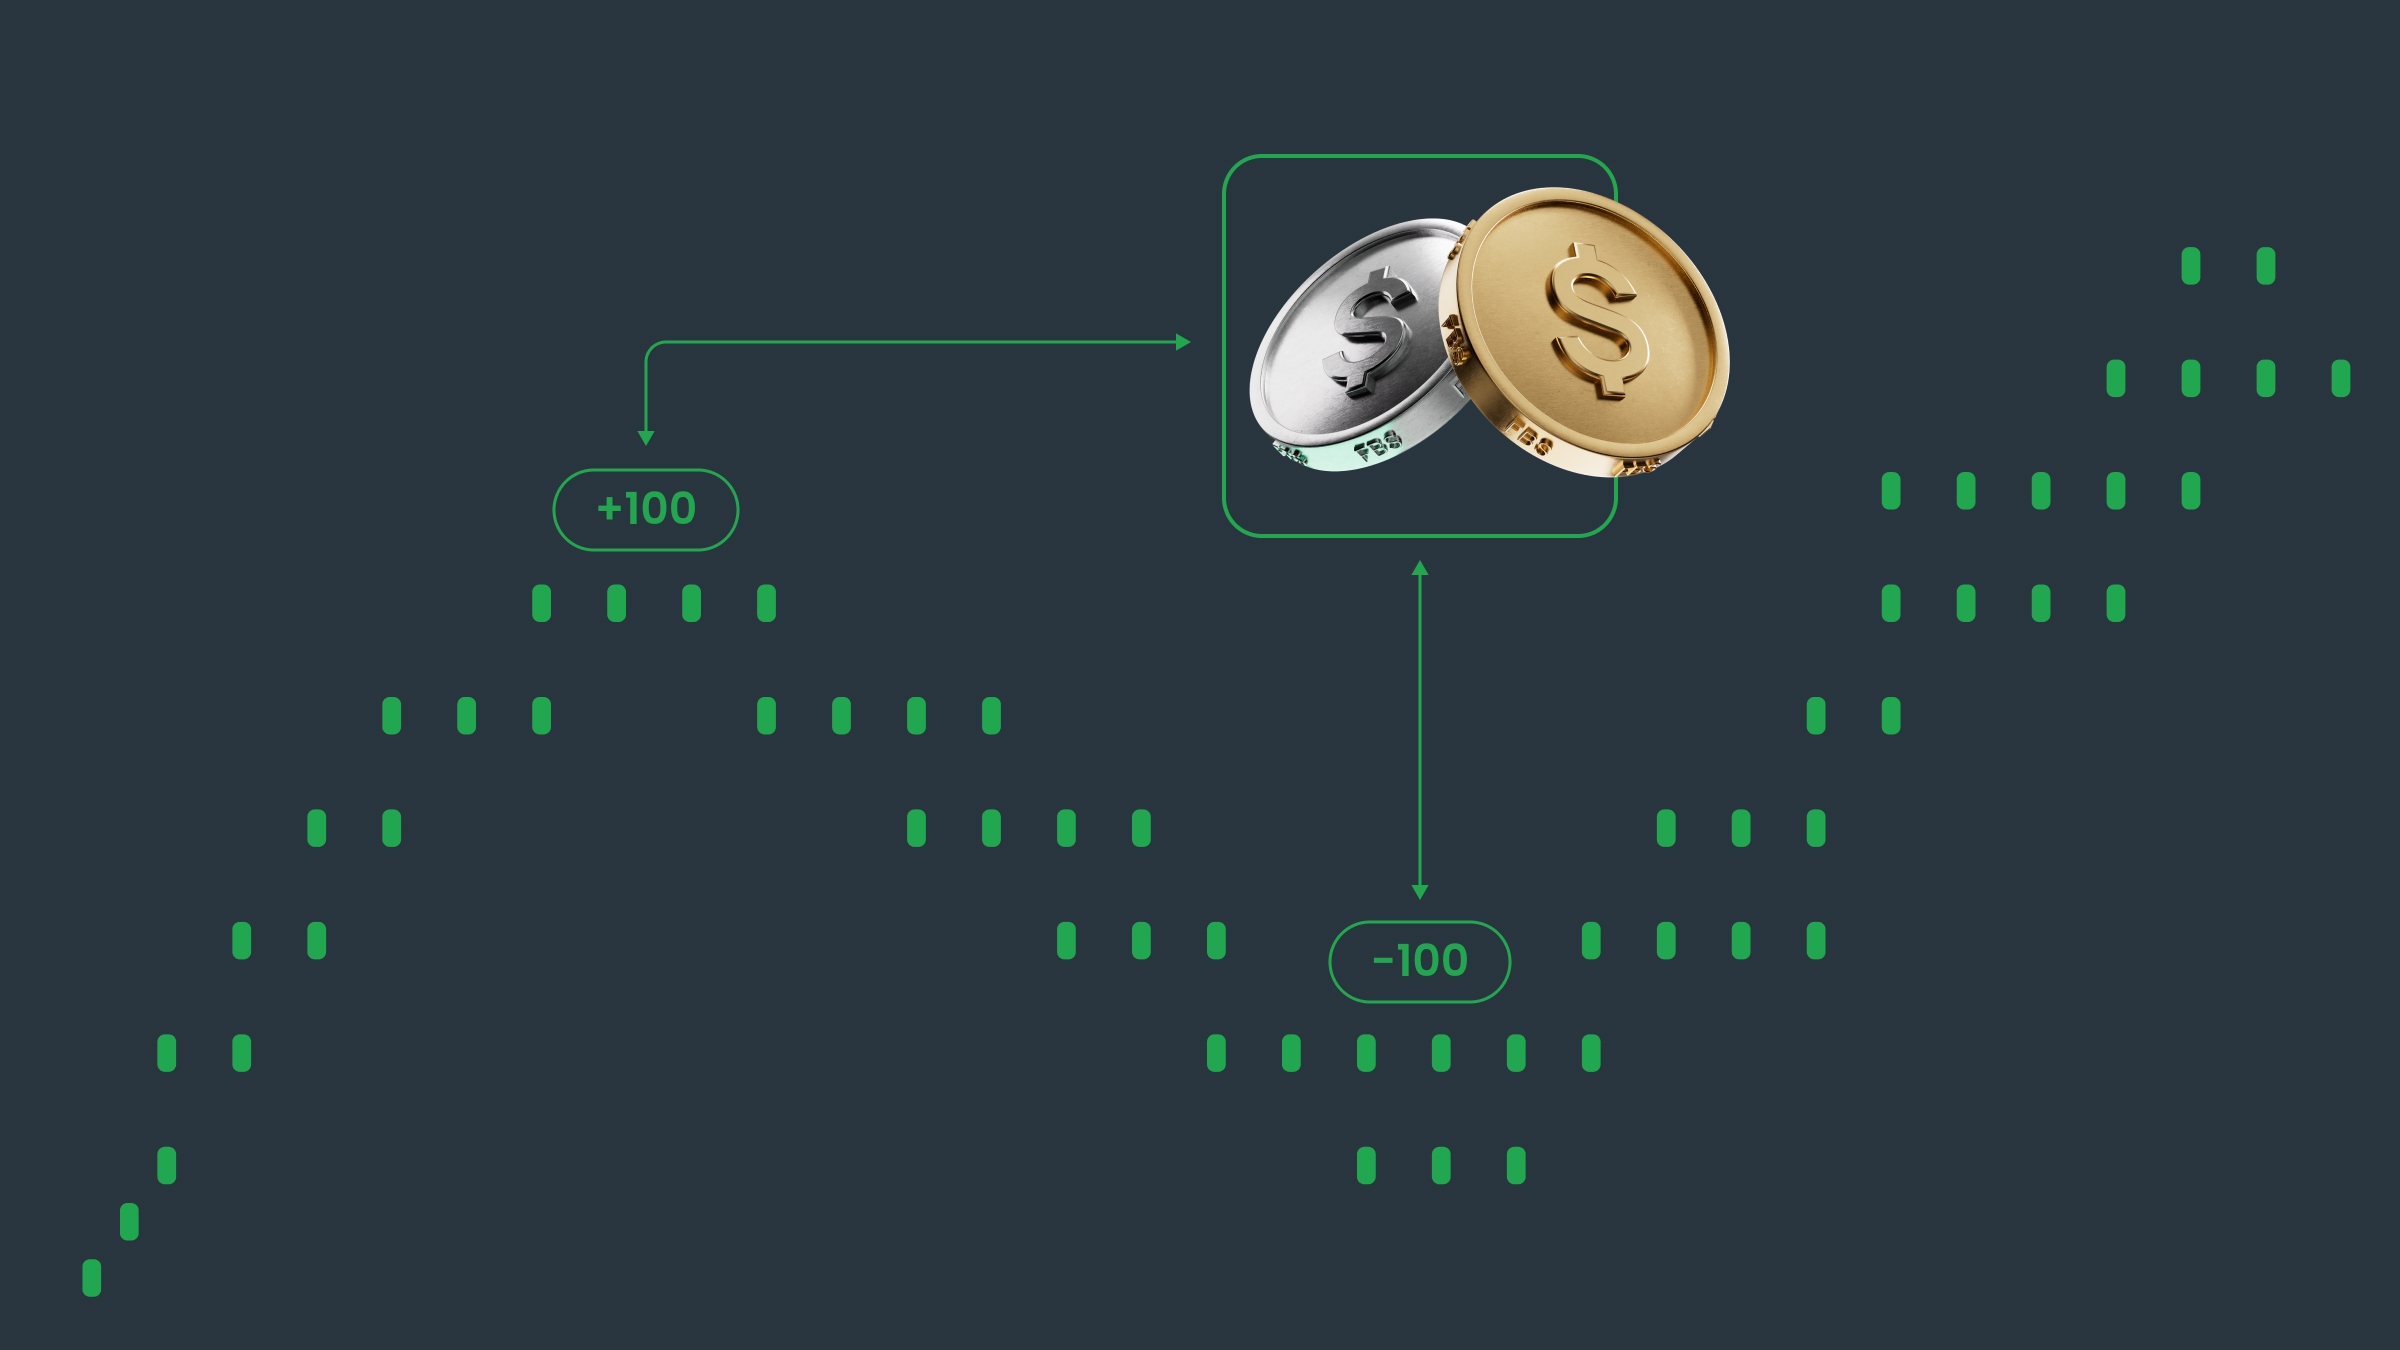
As we already know, the oscillator consists of an indicator line, which moves between two zones - overbought (level above 100) and oversold (level below -100).
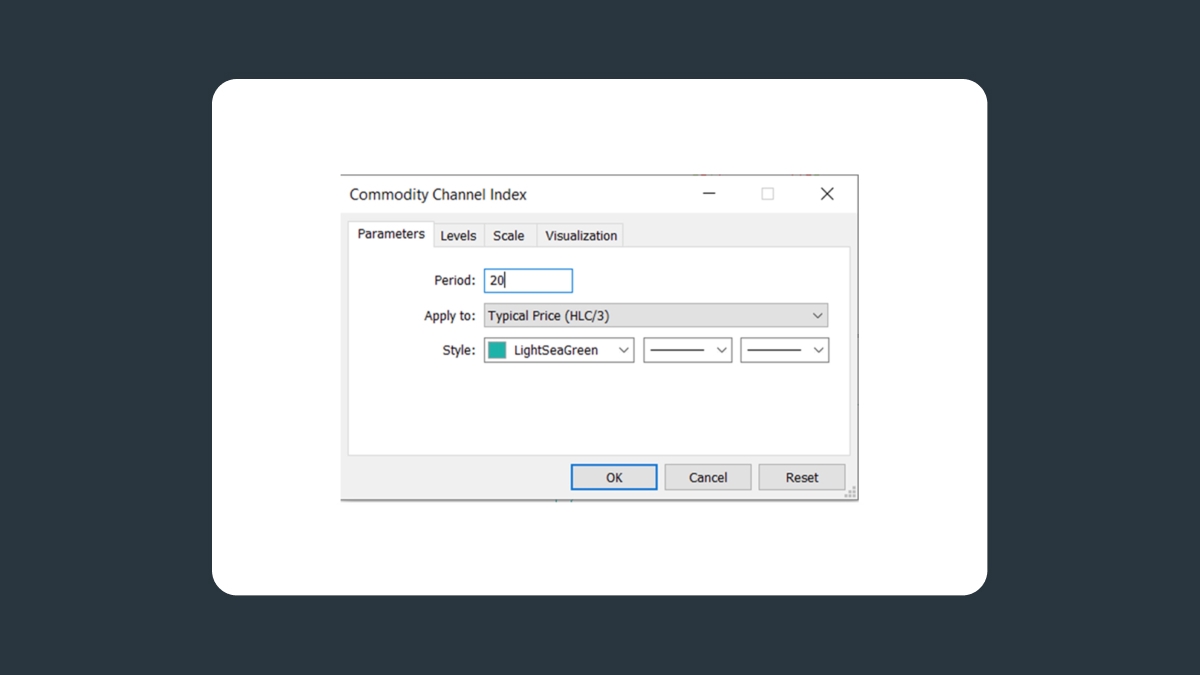
The default order of the indicator is 14.
The indicator’s creator, Donald Lambert, recommended using an indicator order of 20.
How Does the Commodity Channel Index Work?
CCI line crossing with its boundary levels
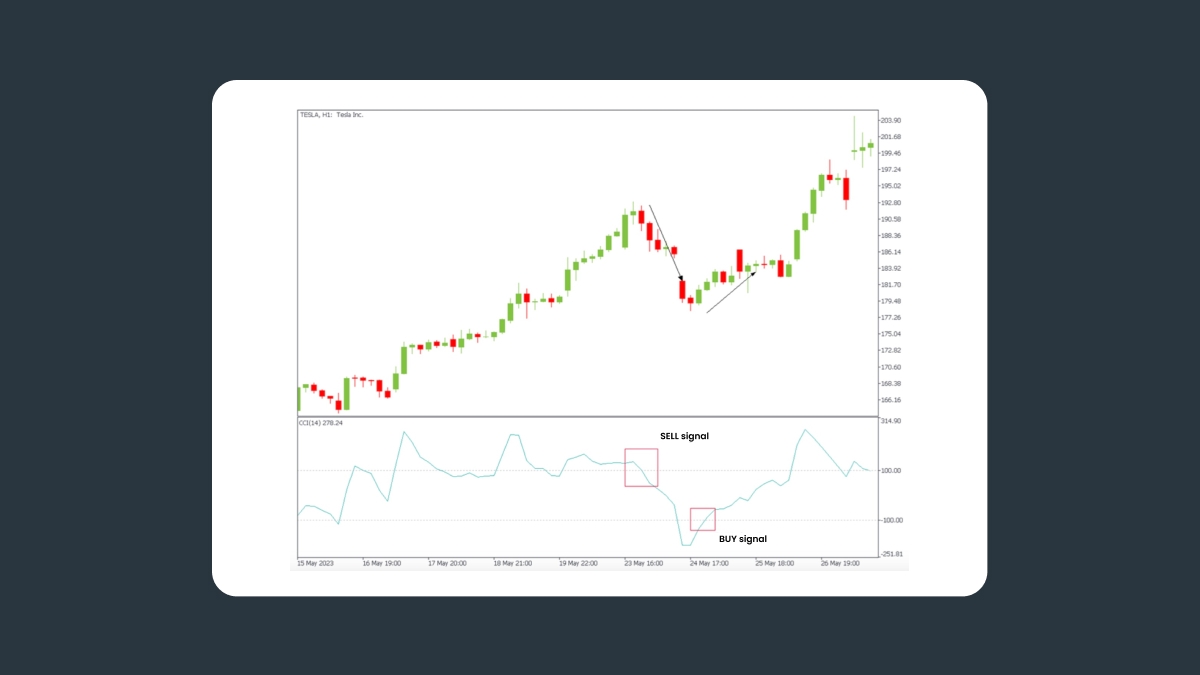
The first and most important type of signal from the indicator is, of course, the entry of the CCI line into the overbought (above +100%) or oversold (below -100%) zone.
The CCI belongs to that rare category of indicators, the interpretation of which is somewhat different. Some analysts believe the CCI indicator signals when it leaves its overbought/oversold zone.
For example, if the CCI exits the oversold zone (-100%), it is a signal to open a trade upwards.
Conversely, if the CCI exits the overbought zone (+100%), it is a signal to open a trade downwards.
Some technical analysts, including Lambert himself, suggested interpreting the indicator differently.
When the indicator crosses the +100% line upwards, it’s time to open long positions.
When the indicator line crosses its lower boundary downwards, open short positions.
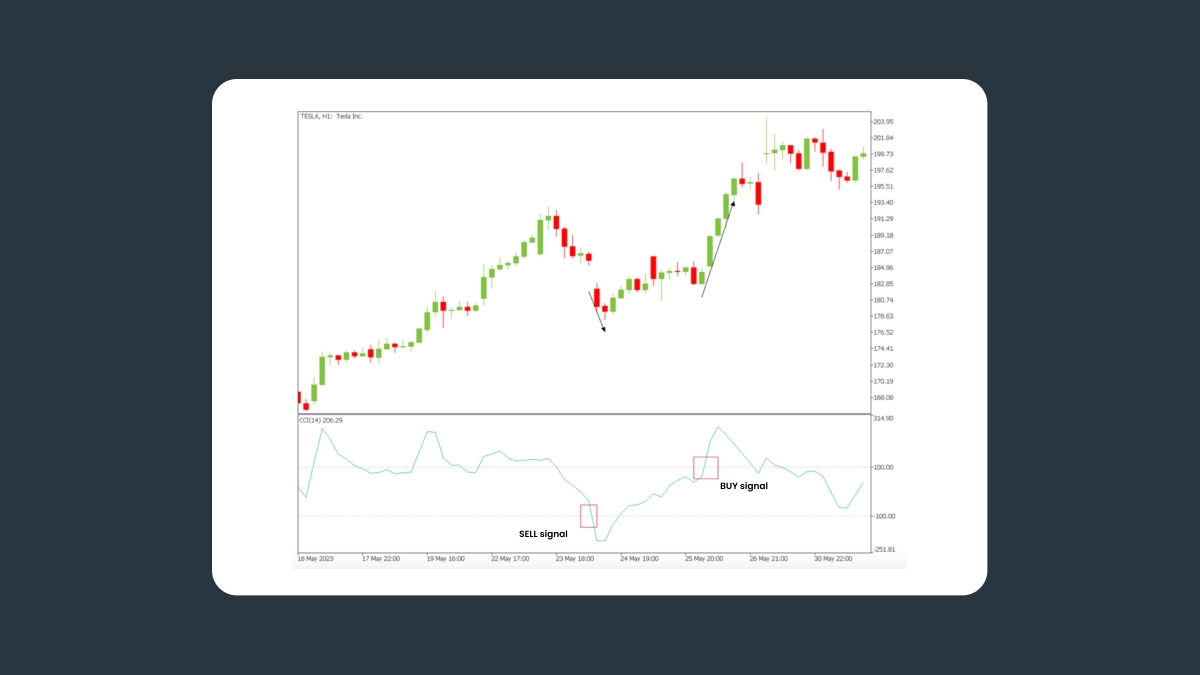
As you can see, some of the false signals are cut off. Thus, the second approach is more accurate.
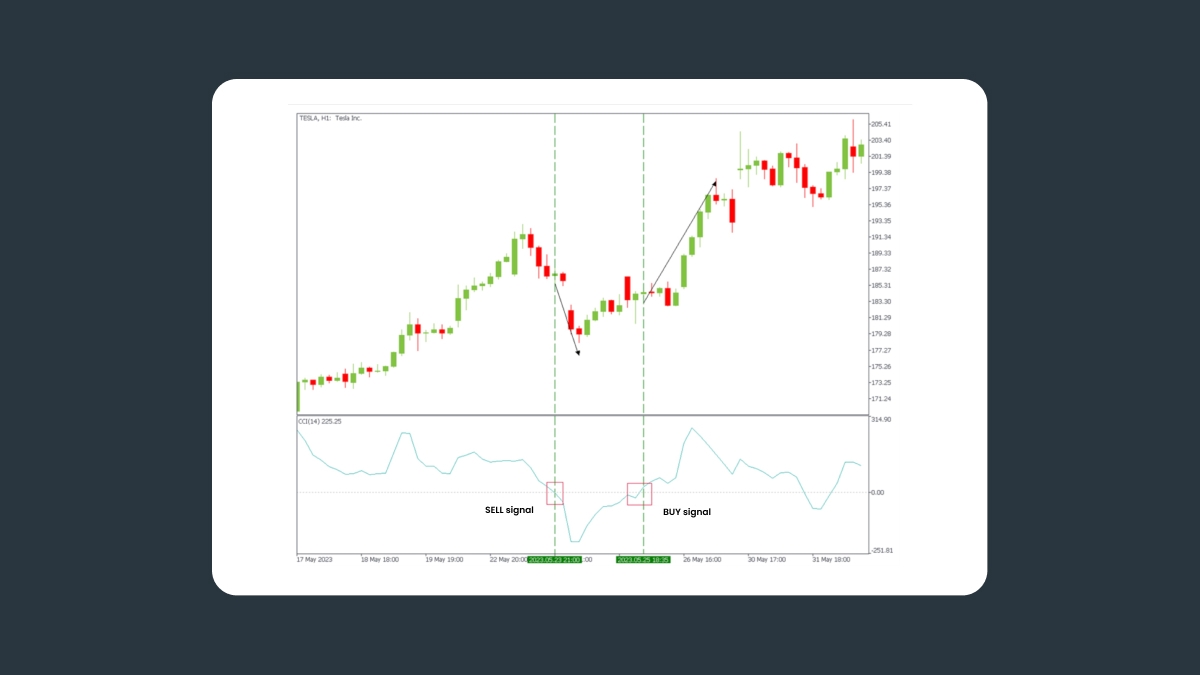
In the Encyclopedia of Technical Market Indicators, Robert Colby suggested using Zero CCI. This is the crossing of the CCI indicator with its zero line. The point is that the CCI line has been in the zone between -100% and 100% for a reasonably long time, which makes it impossible to apply the indicator to the transaction’s opening.
Zero CCI assumes that the trader can independently draw the zero line on the chart and use the following approach:
A long position opens when the CCI indicator line crosses its zero level upwards.
A short position opens when the CCI indicator line crosses its zero level downwards.
Divergence
The second type of signal, which gives the indicator, is less obvious but can also be used in trading - it is the divergence of the indicator’s movement and the price chart.
For example, if the indicator rises while the price falls, this indicates a possible imminent price reversal.
This is not a clear signal, however, it only hints at a change in the trend.
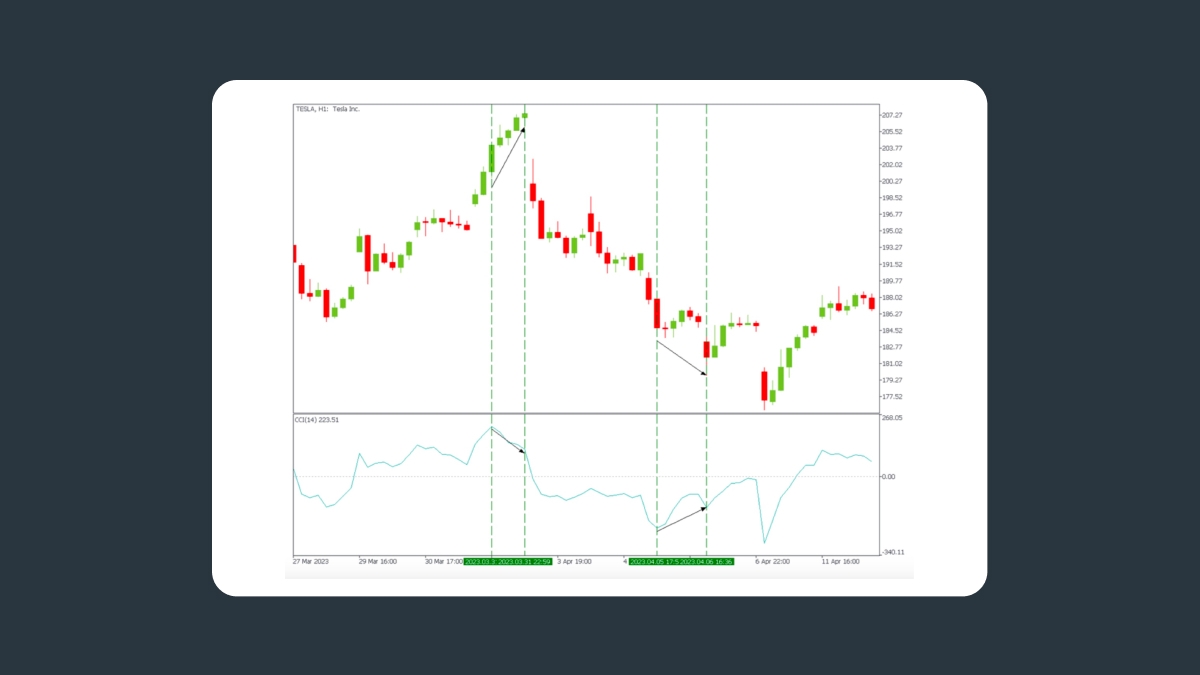
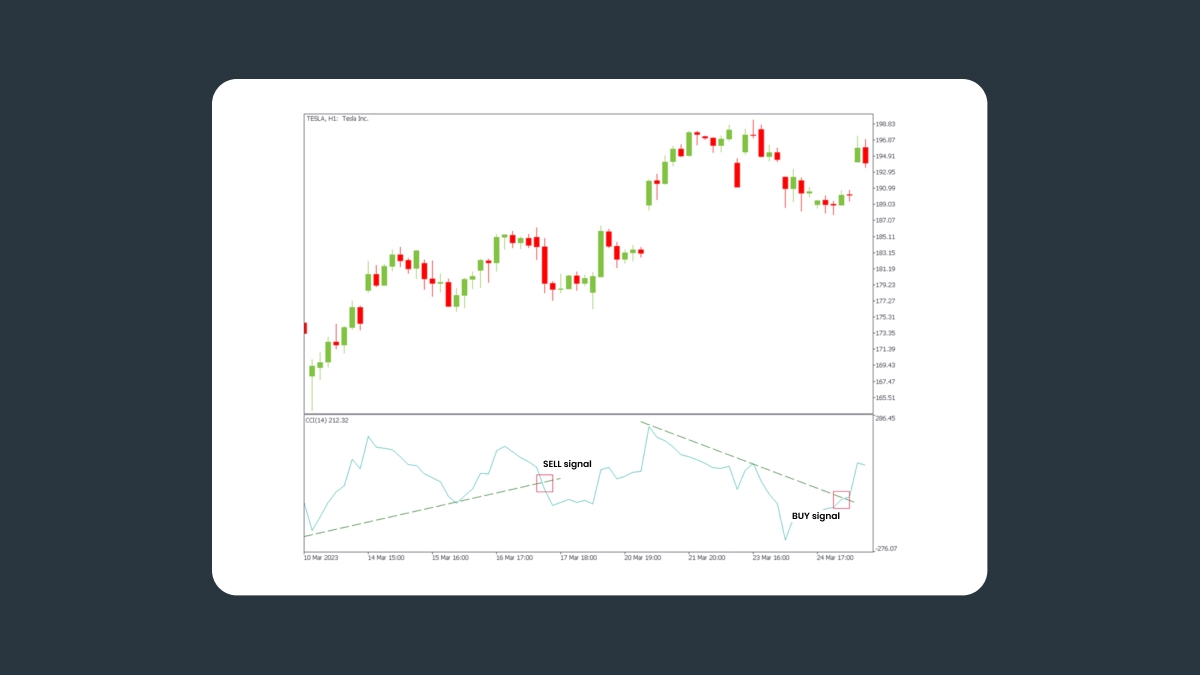
CCI trend lines break
The CCI line can be analyzed just like the price itself. For example, you can build a trend line to the CCI line itself.
If the CCI line breaks its trend line upwards, it signals to open long positions.
If the CCI decreases and breaks its trend line downwards, this is a signal to open short positions.
Summary
The Commodity Channel Index is an effective indicator and can be used on long and short timeframes.
The Commodity Channel Index (CCI) is a powerful and reliable tool for analyzing market trends and entry/exit points that can significantly improve your trading strategy.
Proper use of the indicator requires care and experience, but allows traders to increase their profits significantly. It is important to remember that, as with any technical analysis tool, to get the most accurate and reliable signals, the CCI should be used in conjunction with other indicators and strategies.
If you are looking for a way to improve your trading decisions and increase the accuracy of your analysis, the Commodity Channel Index can be a great addition to your arsenal of trading tools.